Launching soonTry the live demo now. Trial versions are coming soon.
dbTalkby Bandlei

dbTalk · PostgreSQL and MySQL · web and phone

Talk to your database. It answers with evidence.

dbTalk learns what normal looks like for each database, flags what drifts from it, and answers questions like “show drift for the last week” with a chart and the numbers behind it. When a statement regresses, it writes the fix as a script your DBA can test.

0objects installed by dbTalk. It reads the statistics your database already keeps.
2engines: PostgreSQL 12+ and MySQL 5.7+ / MariaDB, self-managed or cloud
5kinds of drift flag, ranked by the database time they cost
7read-only tools for AI agents, over MCP or REST

One page for what changed, when, and what it costs

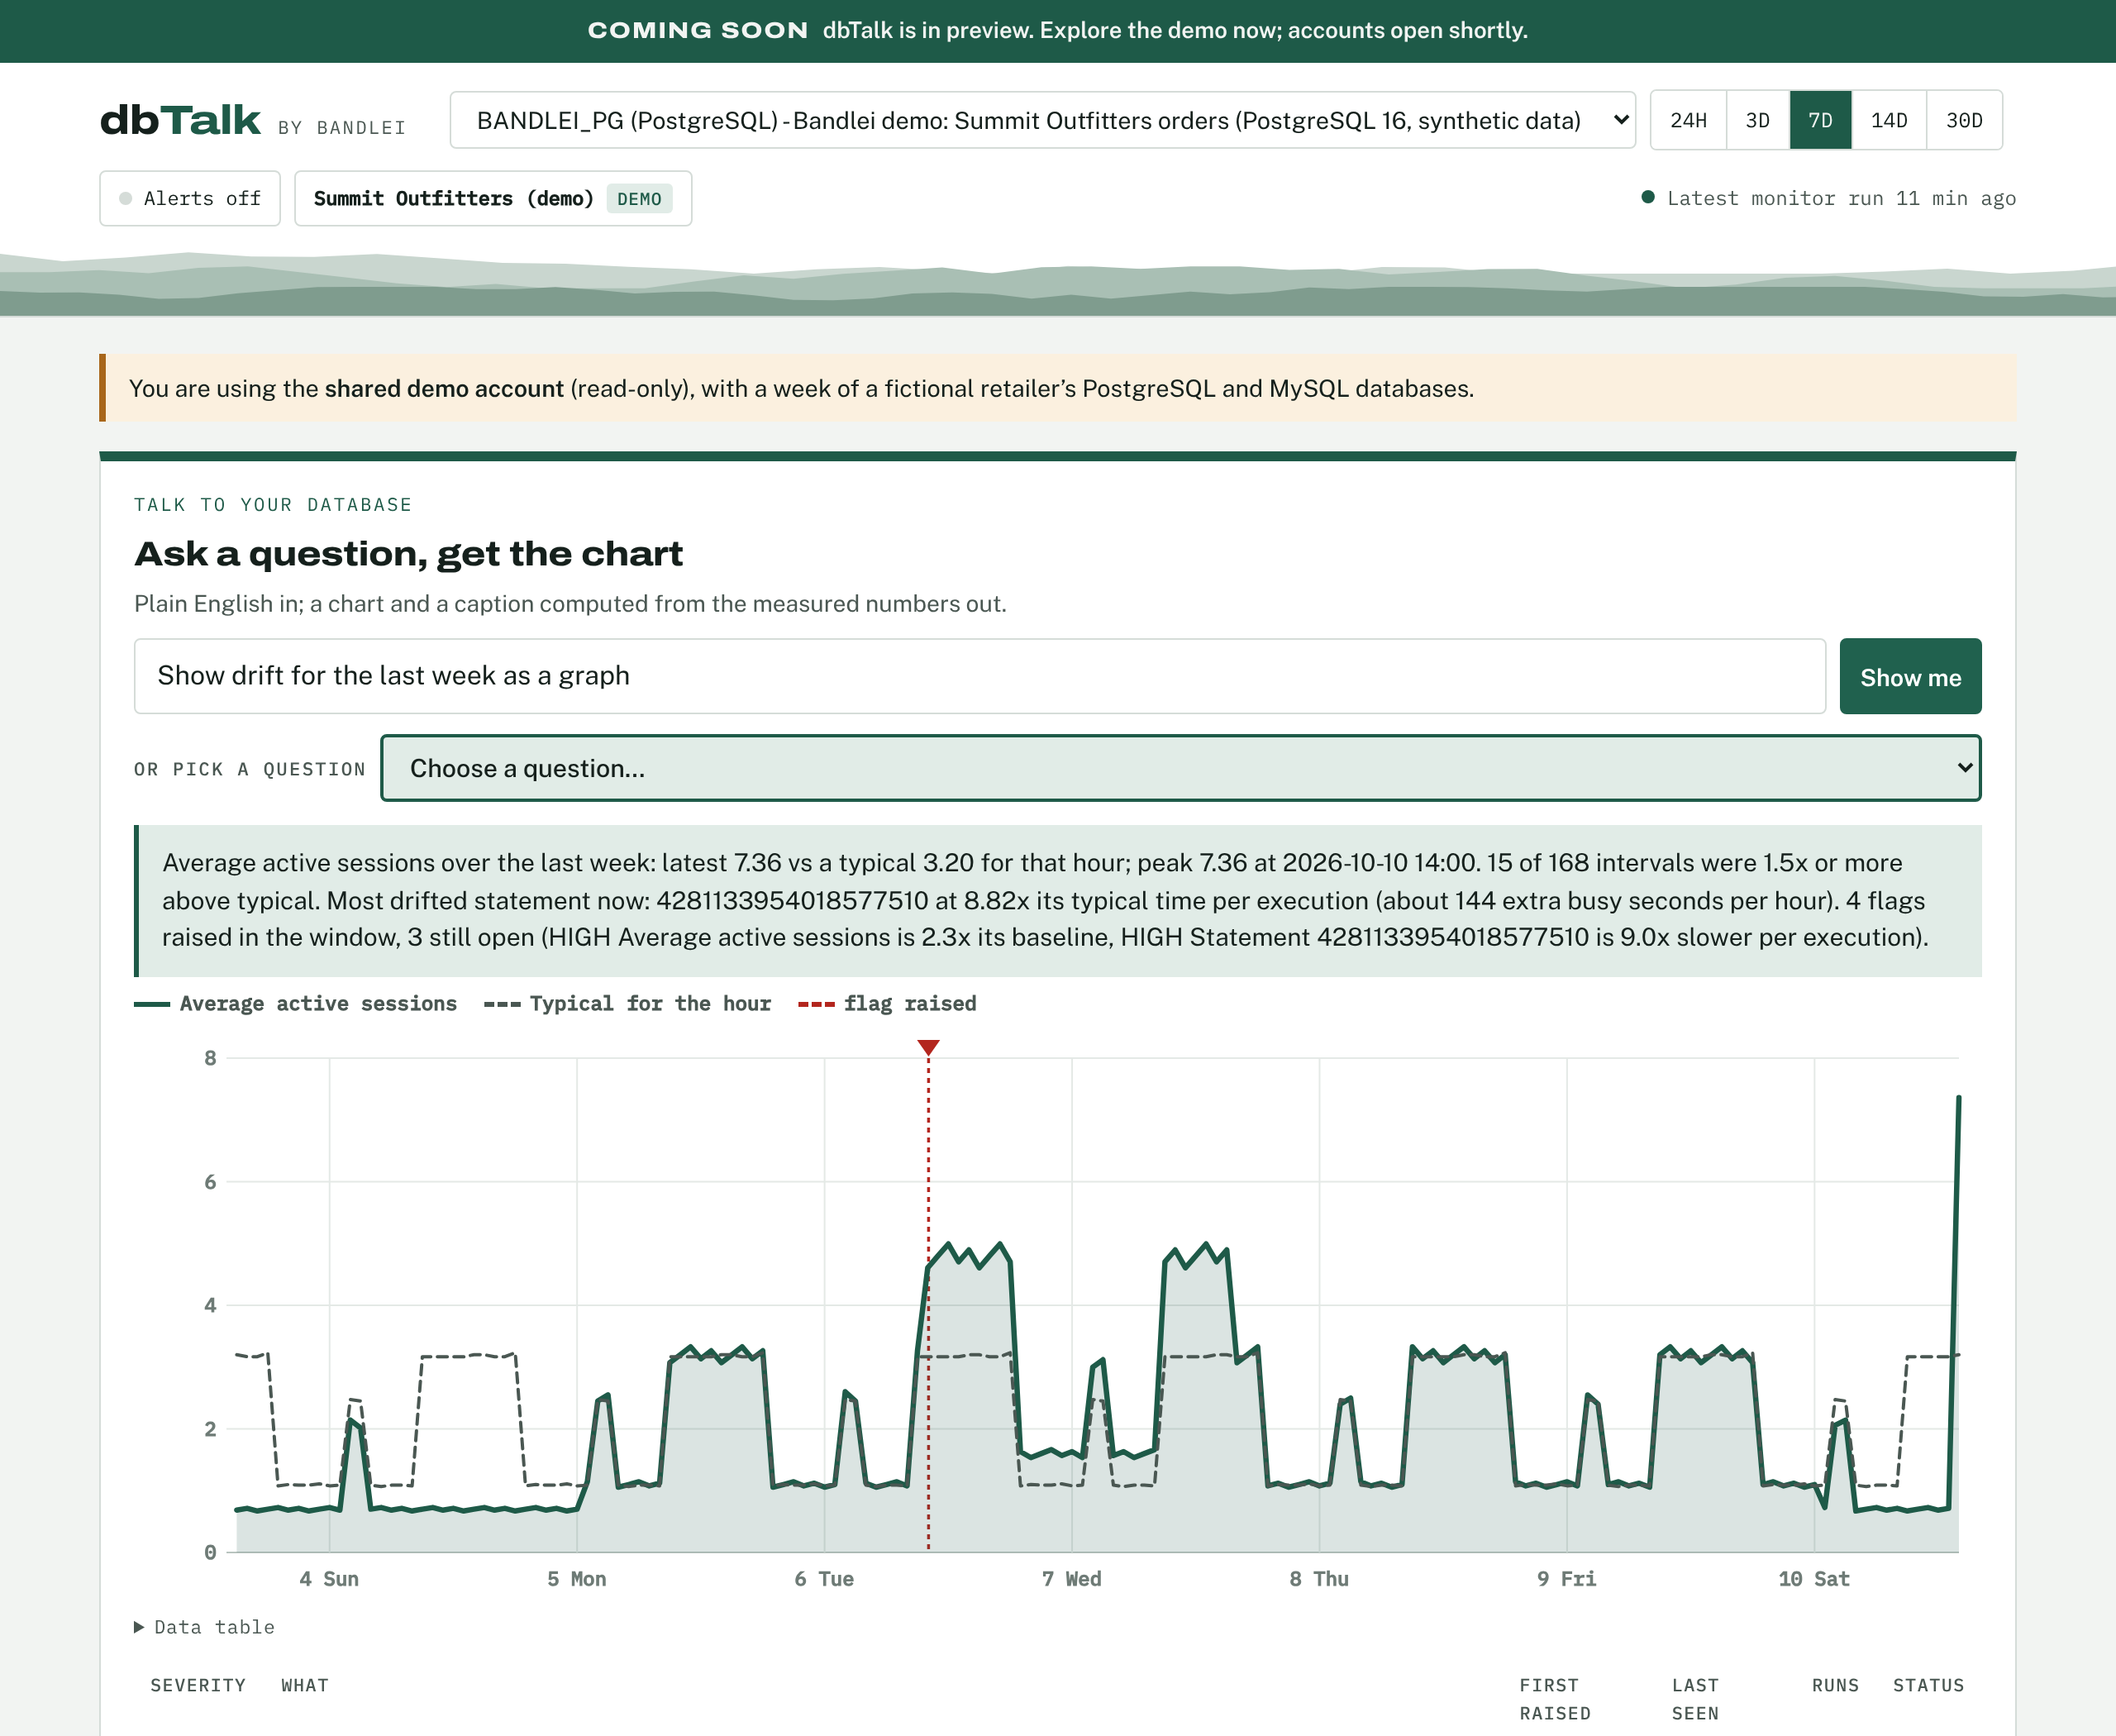
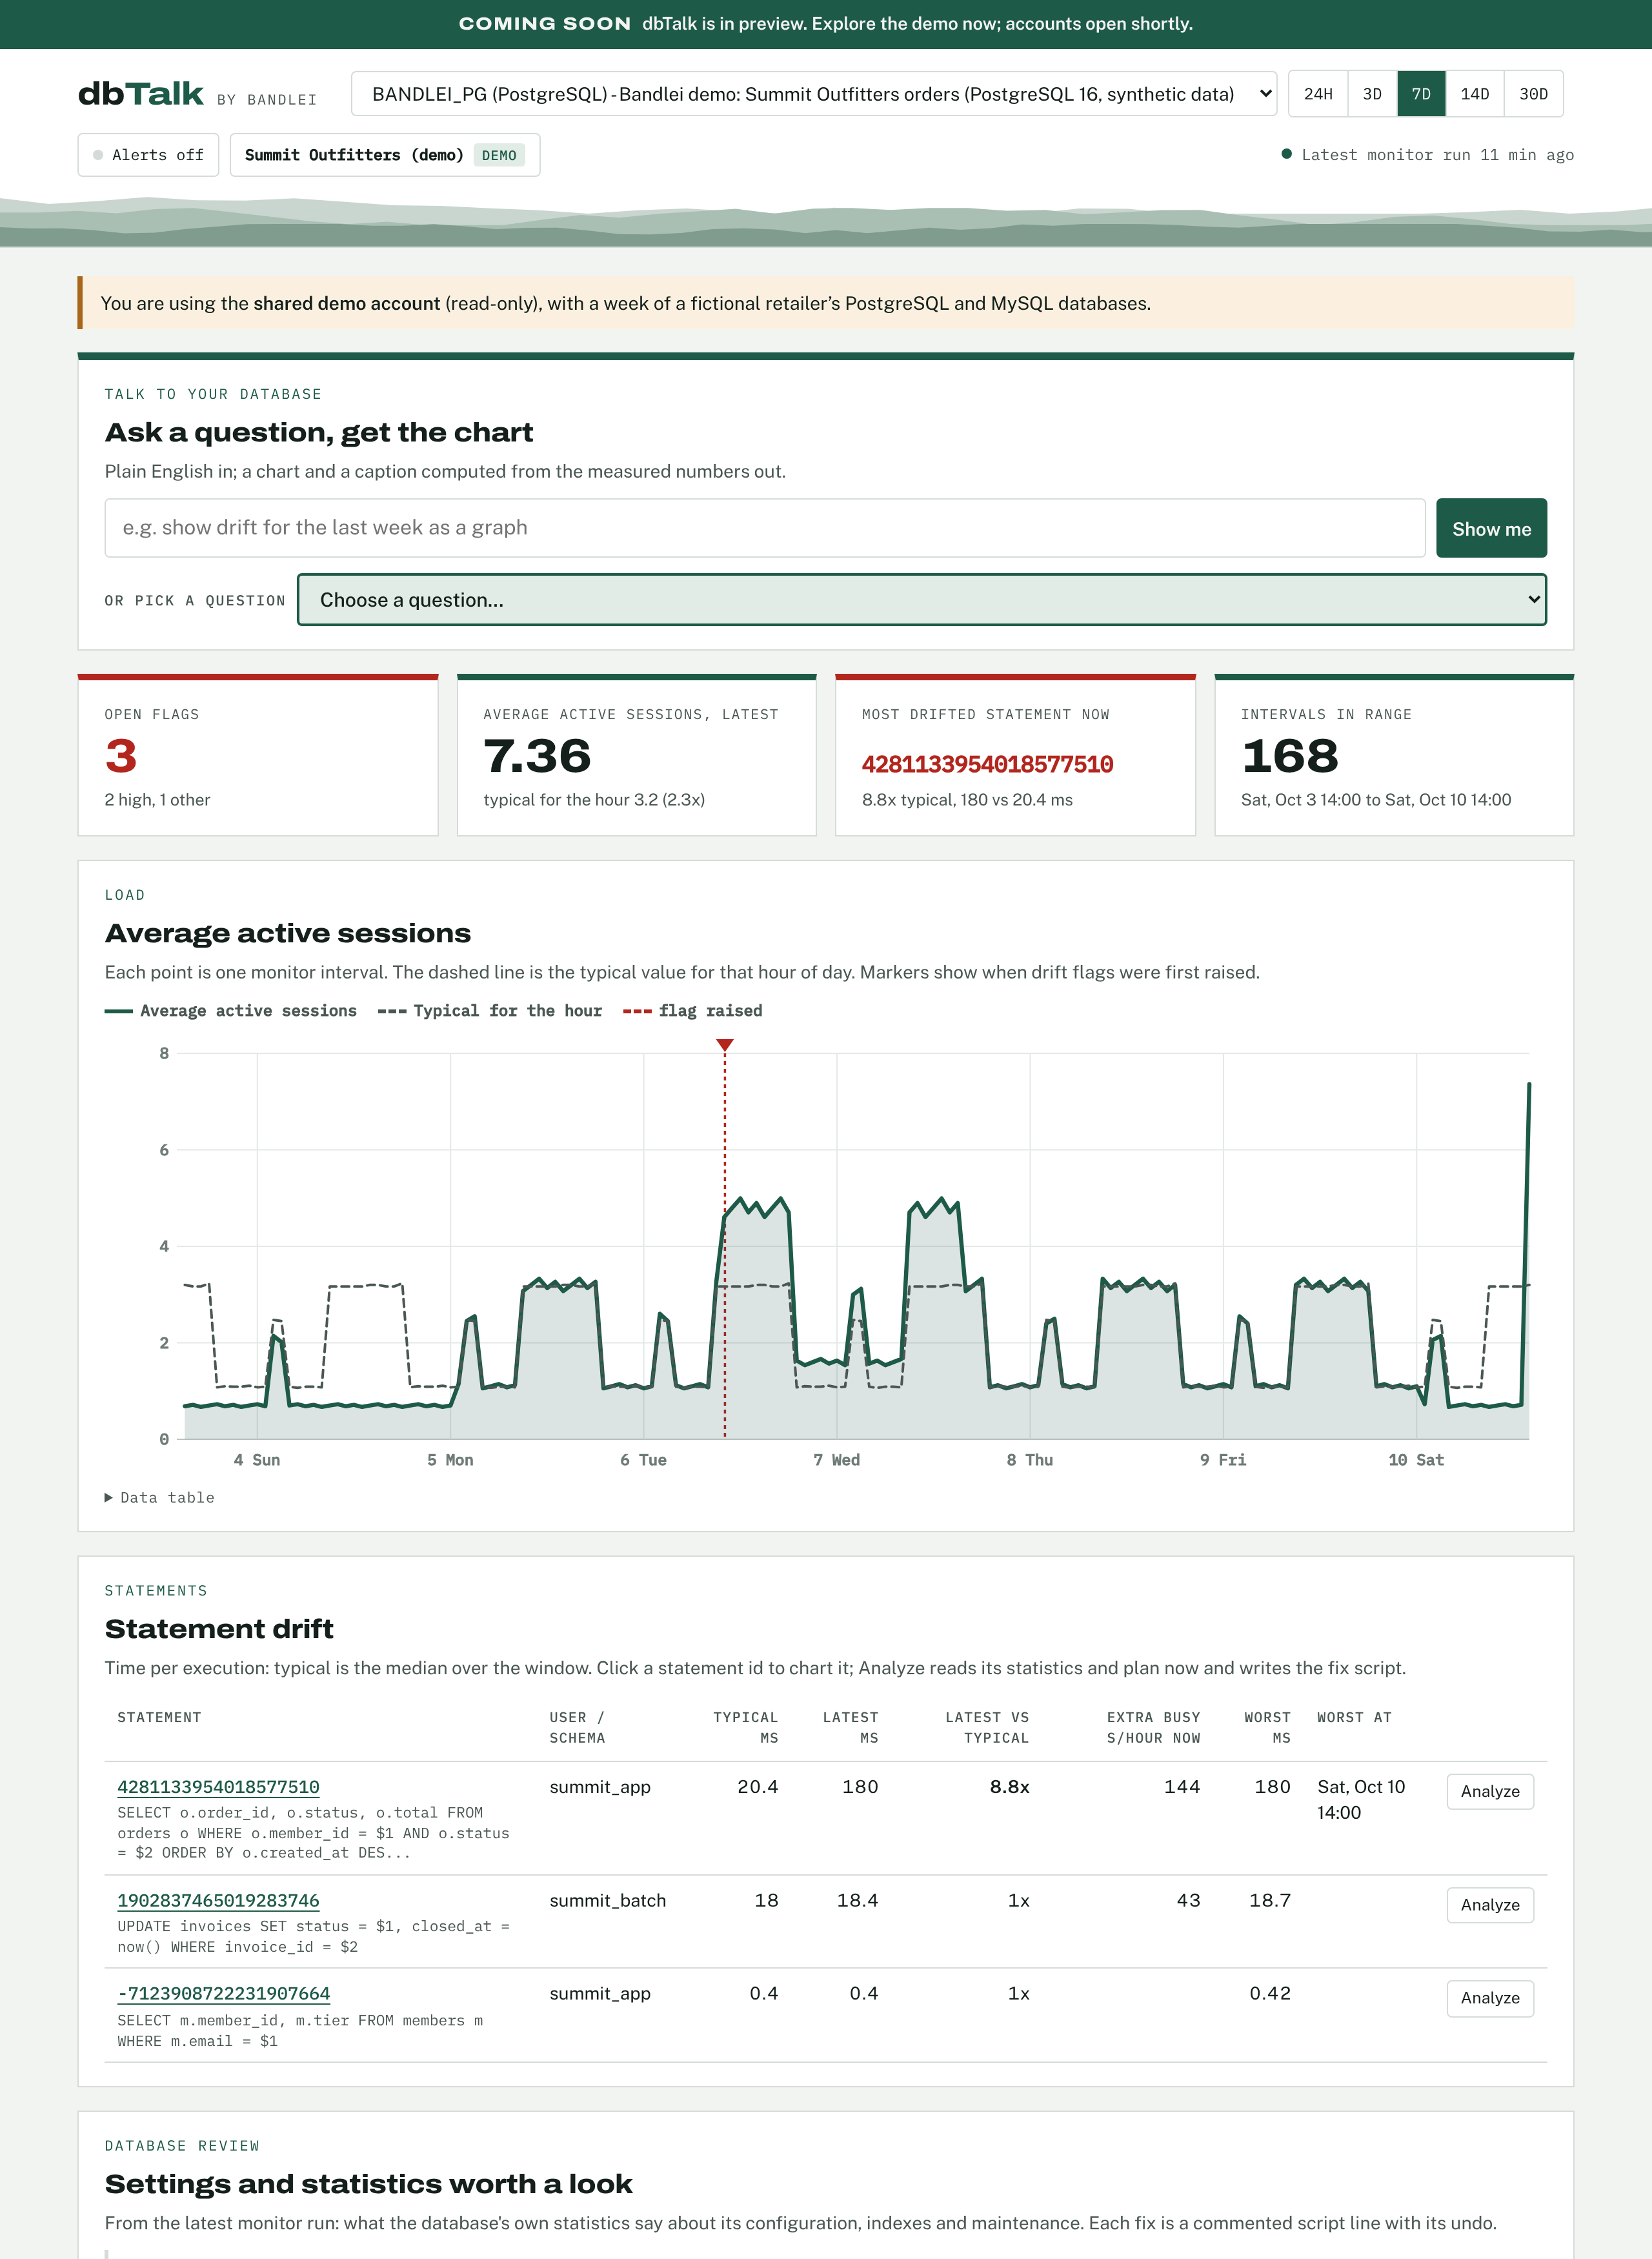
Load against the typical value for that hour of the day, flags as they were raised and resolved, and the statements that drifted, ranked by the extra time they cost, with their text. One click analyzes a statement and writes its fix script.

The dbTalk dashboard: tiles for open flags, load and the most drifted statement; a week of average active sessions against the typical value for the hour with a flag marker; the statement drift table with statement text and Analyze buttons.
The dbTalk dashboard on the built-in PostgreSQL demo database (synthetic data).

Everything a DBA checks first, done every hour

DRIFT

Baselines and drift flags

Hourly measurements per statement, compared with a 14-day median for the same hour of day. Regressions, new heavy statements, execution spikes, plan changes (with pg_stat_monitor) and database-wide drift, each NEW, ONGOING or RESOLVED.

monitor.py · exit 4 = alert
ASK

Questions in plain English

“Load over the last 3 days”, “WAL since yesterday”, “what flags fired this week?”, or a statement id. Built-in rules or your approved model read the question; the chart and caption always come from the data.

shareable answer links
POSTGRESQL

Built on pg_stat_statements

Time, buffer reads, disk reads, temp spill and WAL per statement, on every version from 12 to 17. Uses pg_stat_monitor, pg_wait_sampling, pg_qualstats and track_io_timing when they are there.

pg_monitor role only
MYSQL

Built on performance_schema

Statement digests with rows examined against rows returned, full scans and joins, on-disk temp tables and lock time. Explains a sample statement and reads index usage and waits when enabled.

SELECT on performance_schema
DIAGNOSE

Why one statement is slow

Missing indexes found in the plan, temp spills, disk-bound reads, rows examined per row returned, N+1 query patterns, planning and JIT overhead, and unstable run times.

Analyze button · analyze_statement
FIX

Fix scripts a DBA can test

CREATE INDEX CONCURRENTLY, ALTER TABLE … ALGORITHM=INPLACE, LOCK=NONE, per-role settings, invisible indexes before drops. Every line commented out, every step with its undo. Never runs by itself.

fix_<id>.sql
REVIEW

Settings and maintenance

Cache hit ratio, dead rows and vacuum, never-analyzed tables, unused indexes, forced checkpoints, buffer pool misses, redo capacity, connection headroom, checked against this database’s own numbers.

database_fix.sql
SETUP

Tells you what to turn on

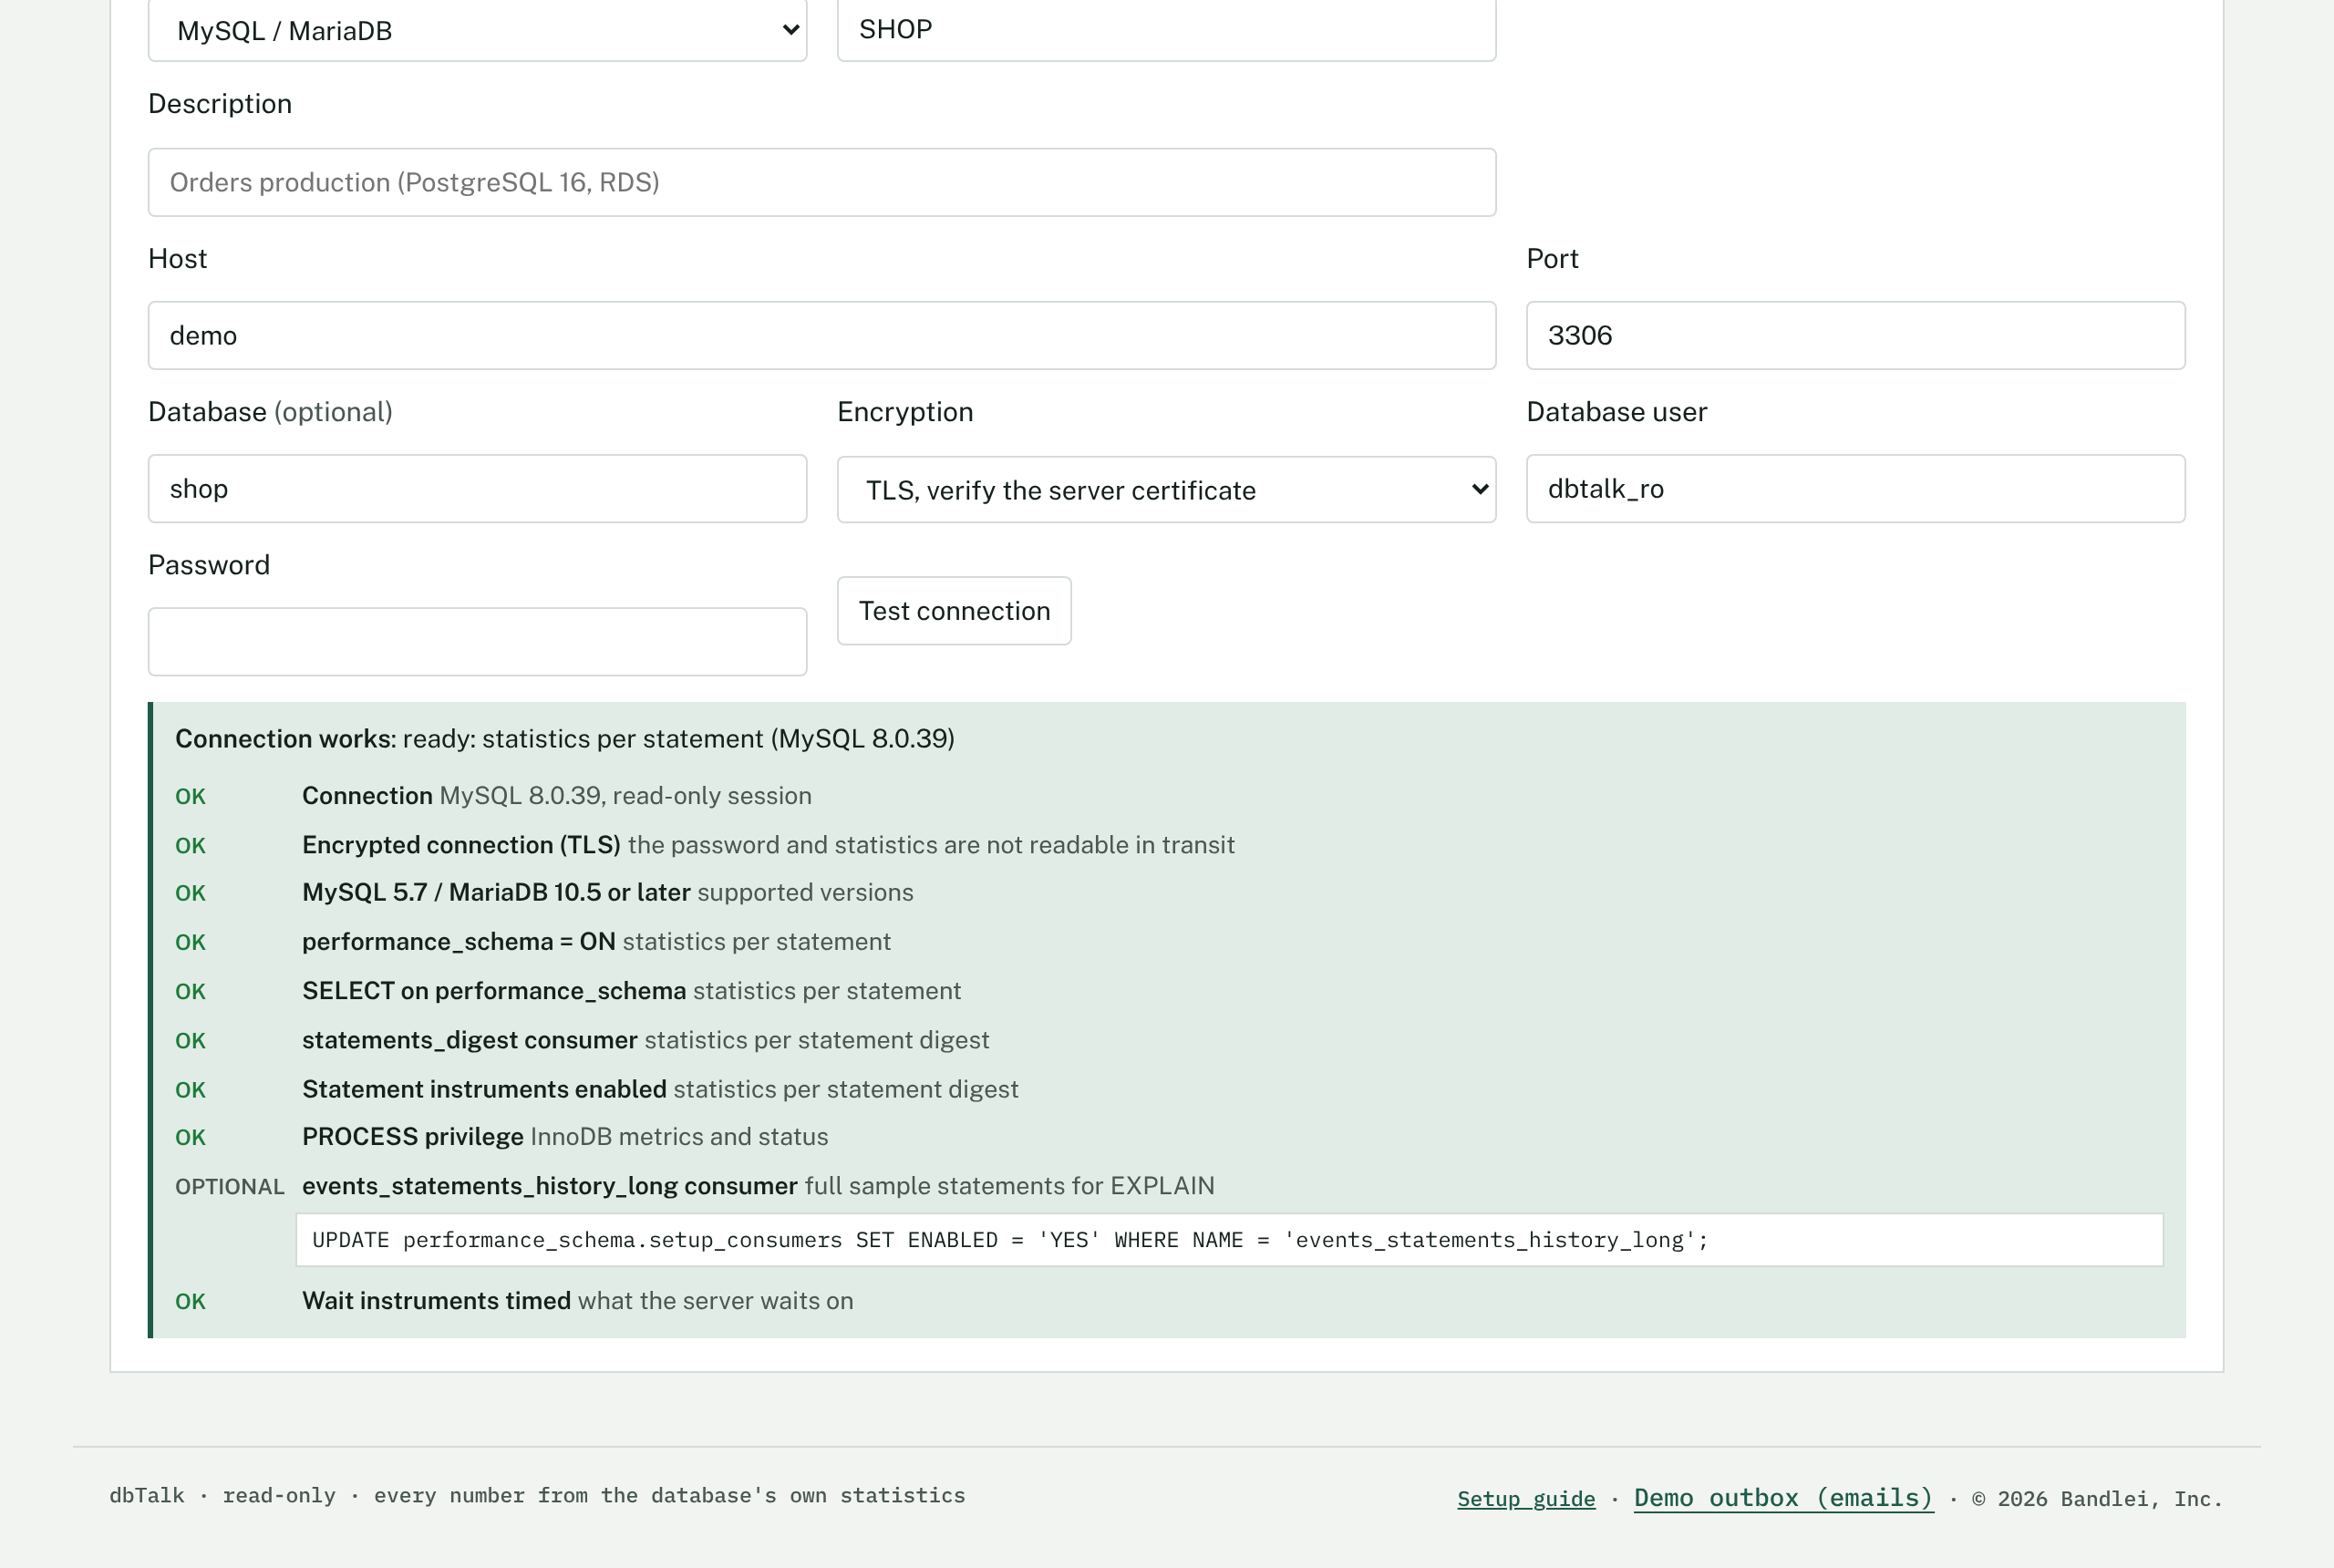
The connection test lists every statistic dbTalk reads as OK, missing or optional, with the exact command or my.cnf line to enable it. Managed-service settings are in the guide.

grants_postgres.sql · grants_mysql.sql
AGENTS

Tools for your AI platform

Seven read-only tools over MCP or REST with an OpenAPI description, input validation, literal redaction and an audit log of every call.

mcp_server.py
How dbTalk works

Measure, compare, flag, explain, fix.

A read-only user and a schedule are all it needs. dbTalk installs nothing in the database, and the website and agent tools read the stored history; only the hourly monitor and the Analyze button connect, read-only.

Collect

Differences between hourly reads of pg_stat_statements or the performance_schema digest table, plus database-wide counters. Restarts and statistics resets detected.

Baseline

Median and spread of each measure over 14 days, by hour of day, so the 9 AM batch peak is normal, not an alert.

Flag

Regressions, new heavy statements, spikes, plan changes and database-wide drift, sized by the extra time they cost.

Explain

Plain-English captions and answers computed from the measurements. A model, if you use one, only chooses what to show.

Fix

Statement and plan analysis of the worst regressions and a step-by-step test script with undo, for change control.

Built for strict security boundaries

Read-only sessions with statement time limits, and the smallest grants each engine offers (pg_monitor; SELECT on performance_schema). TLS with certificate verification by default. Literals in SQL are redacted before anything reaches a model. Every question and tool call is written to an audit log. Hosted sign-in uses scrypt password hashing, lockouts, single-use reset links and encrypted database credentials.

Ask the way you would ask a colleague

Every answer shows how the question was understood and is computed from stored numbers, so a model cannot invent a figure. Answers are links: send one to whoever needs to see it.

dbTalk answering 'show drift for the last week as a graph' with a caption, a week-long load chart and the open flags.
“Show drift for the last week as a graph”
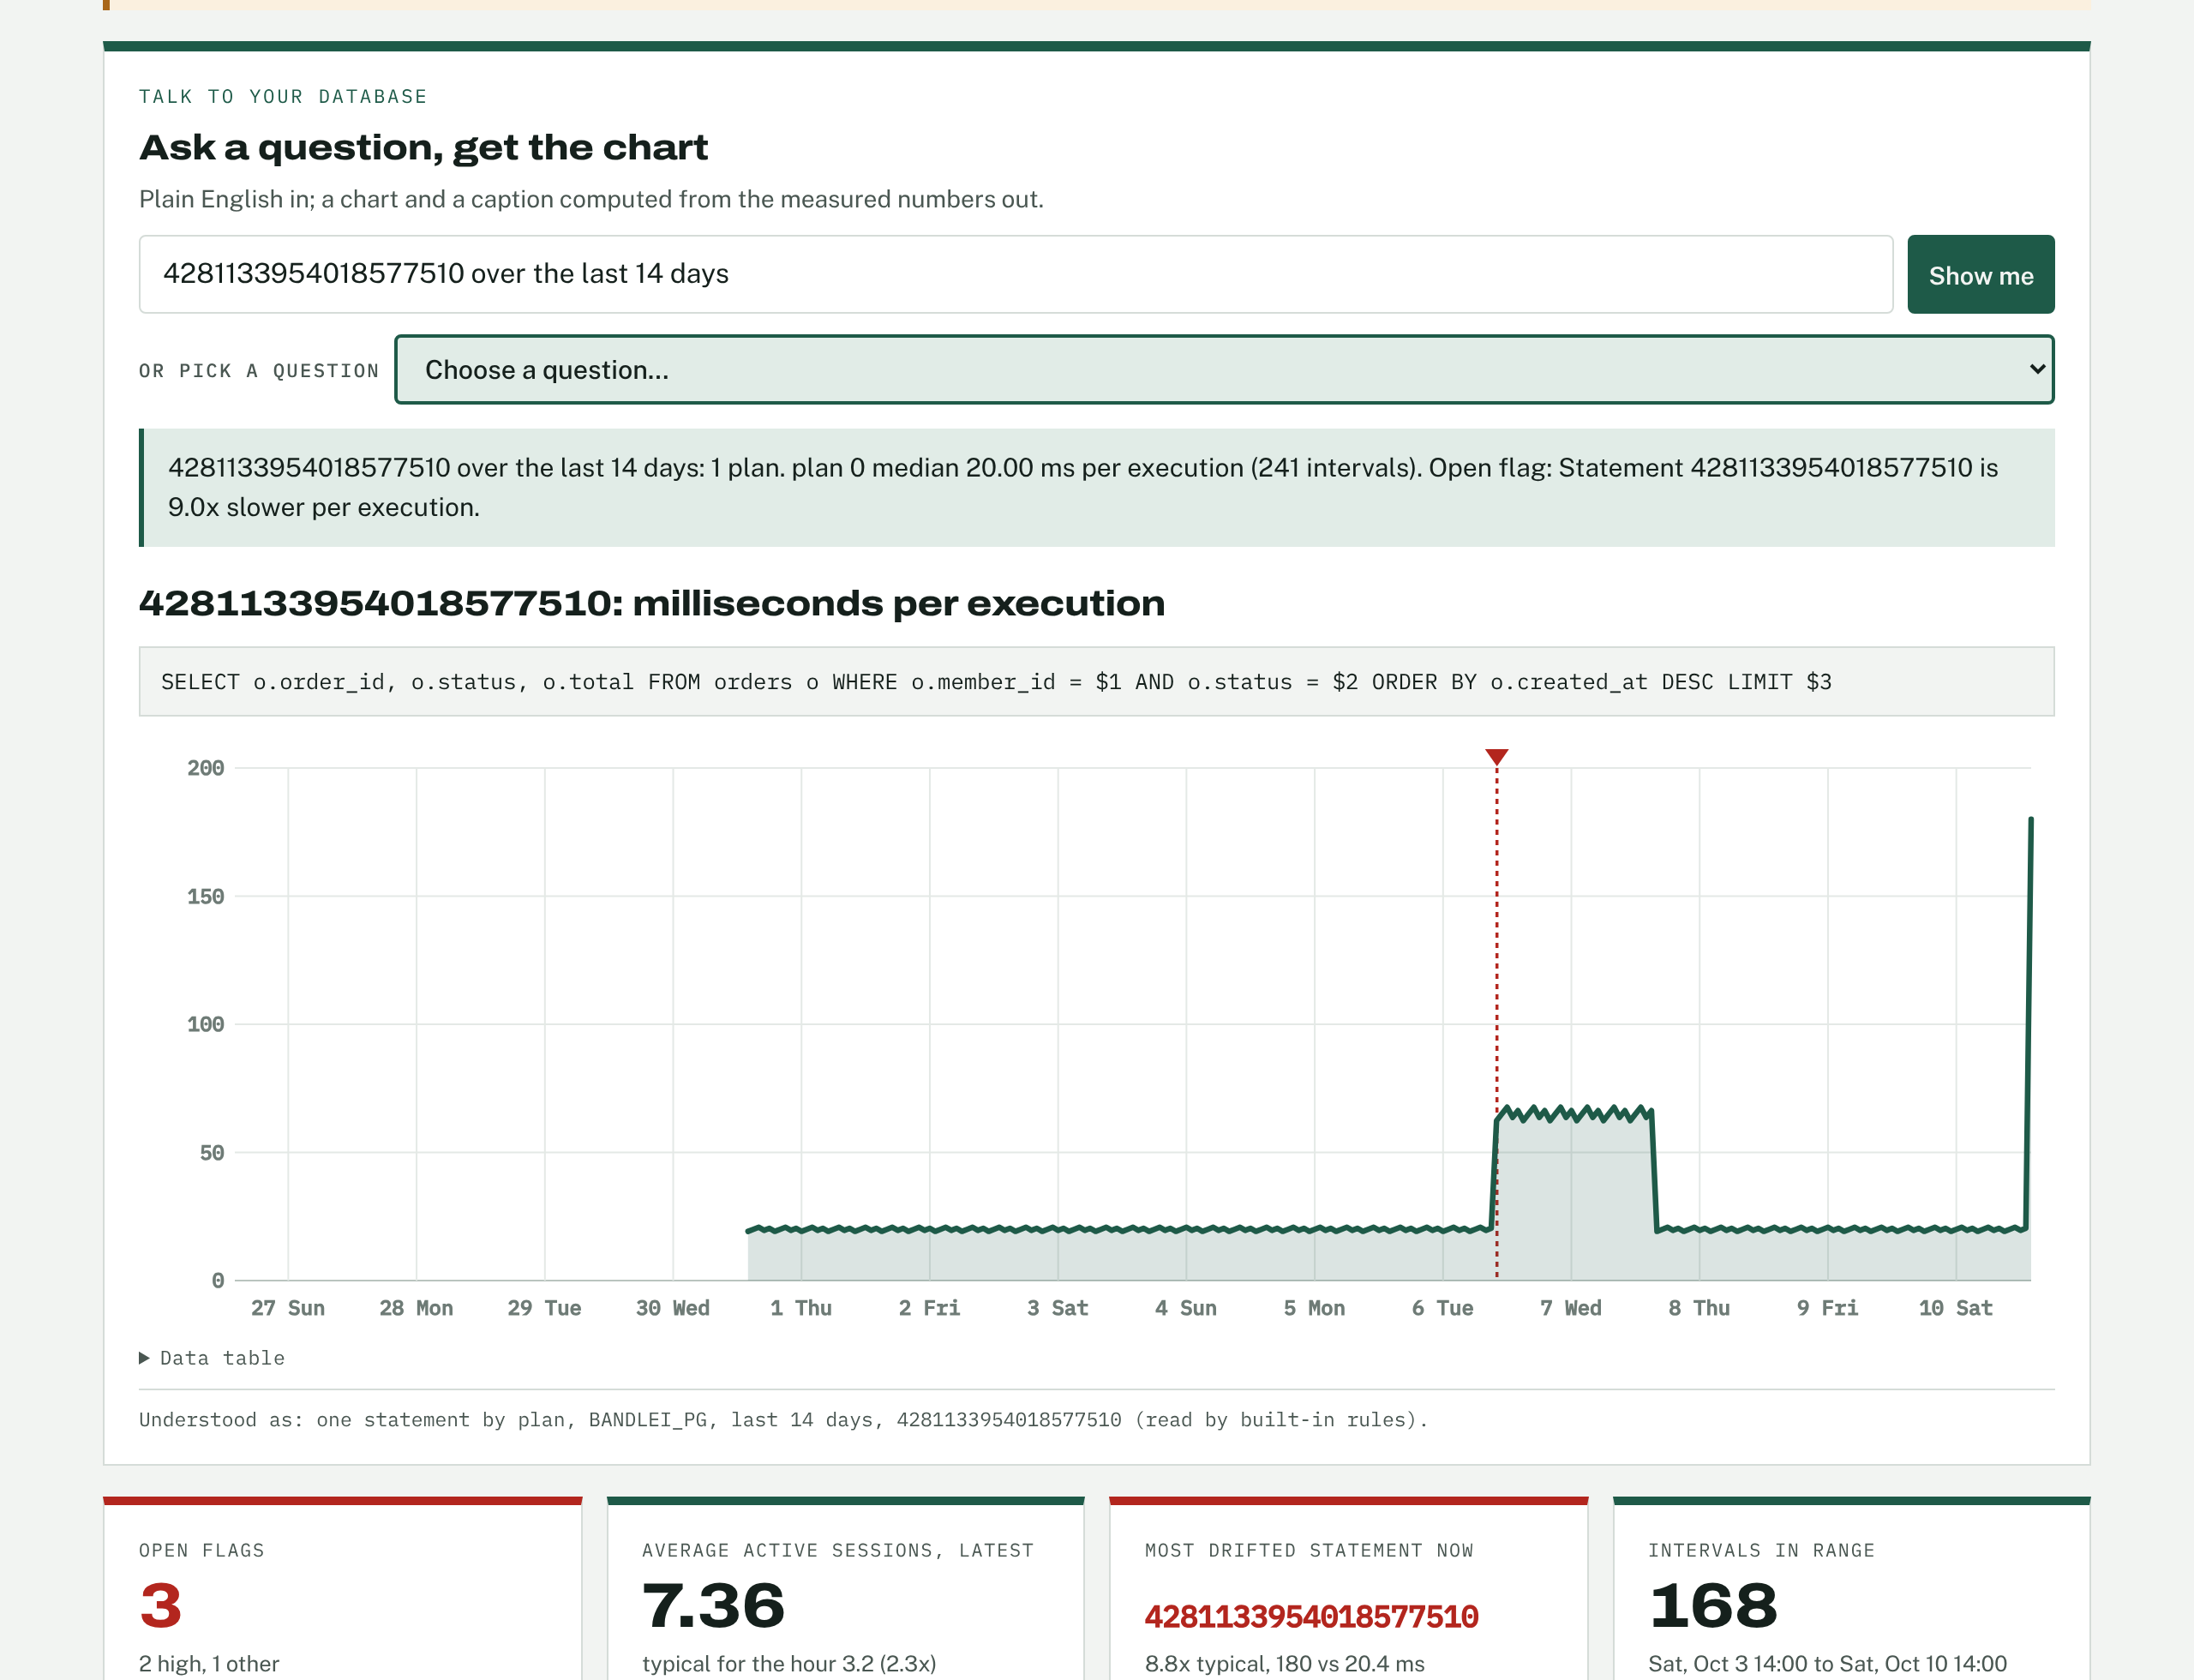
dbTalk answering a question about one statement with its text and milliseconds per execution over 14 days.
One statement over 14 days: time per execution, with its text

On the phone in your pocket

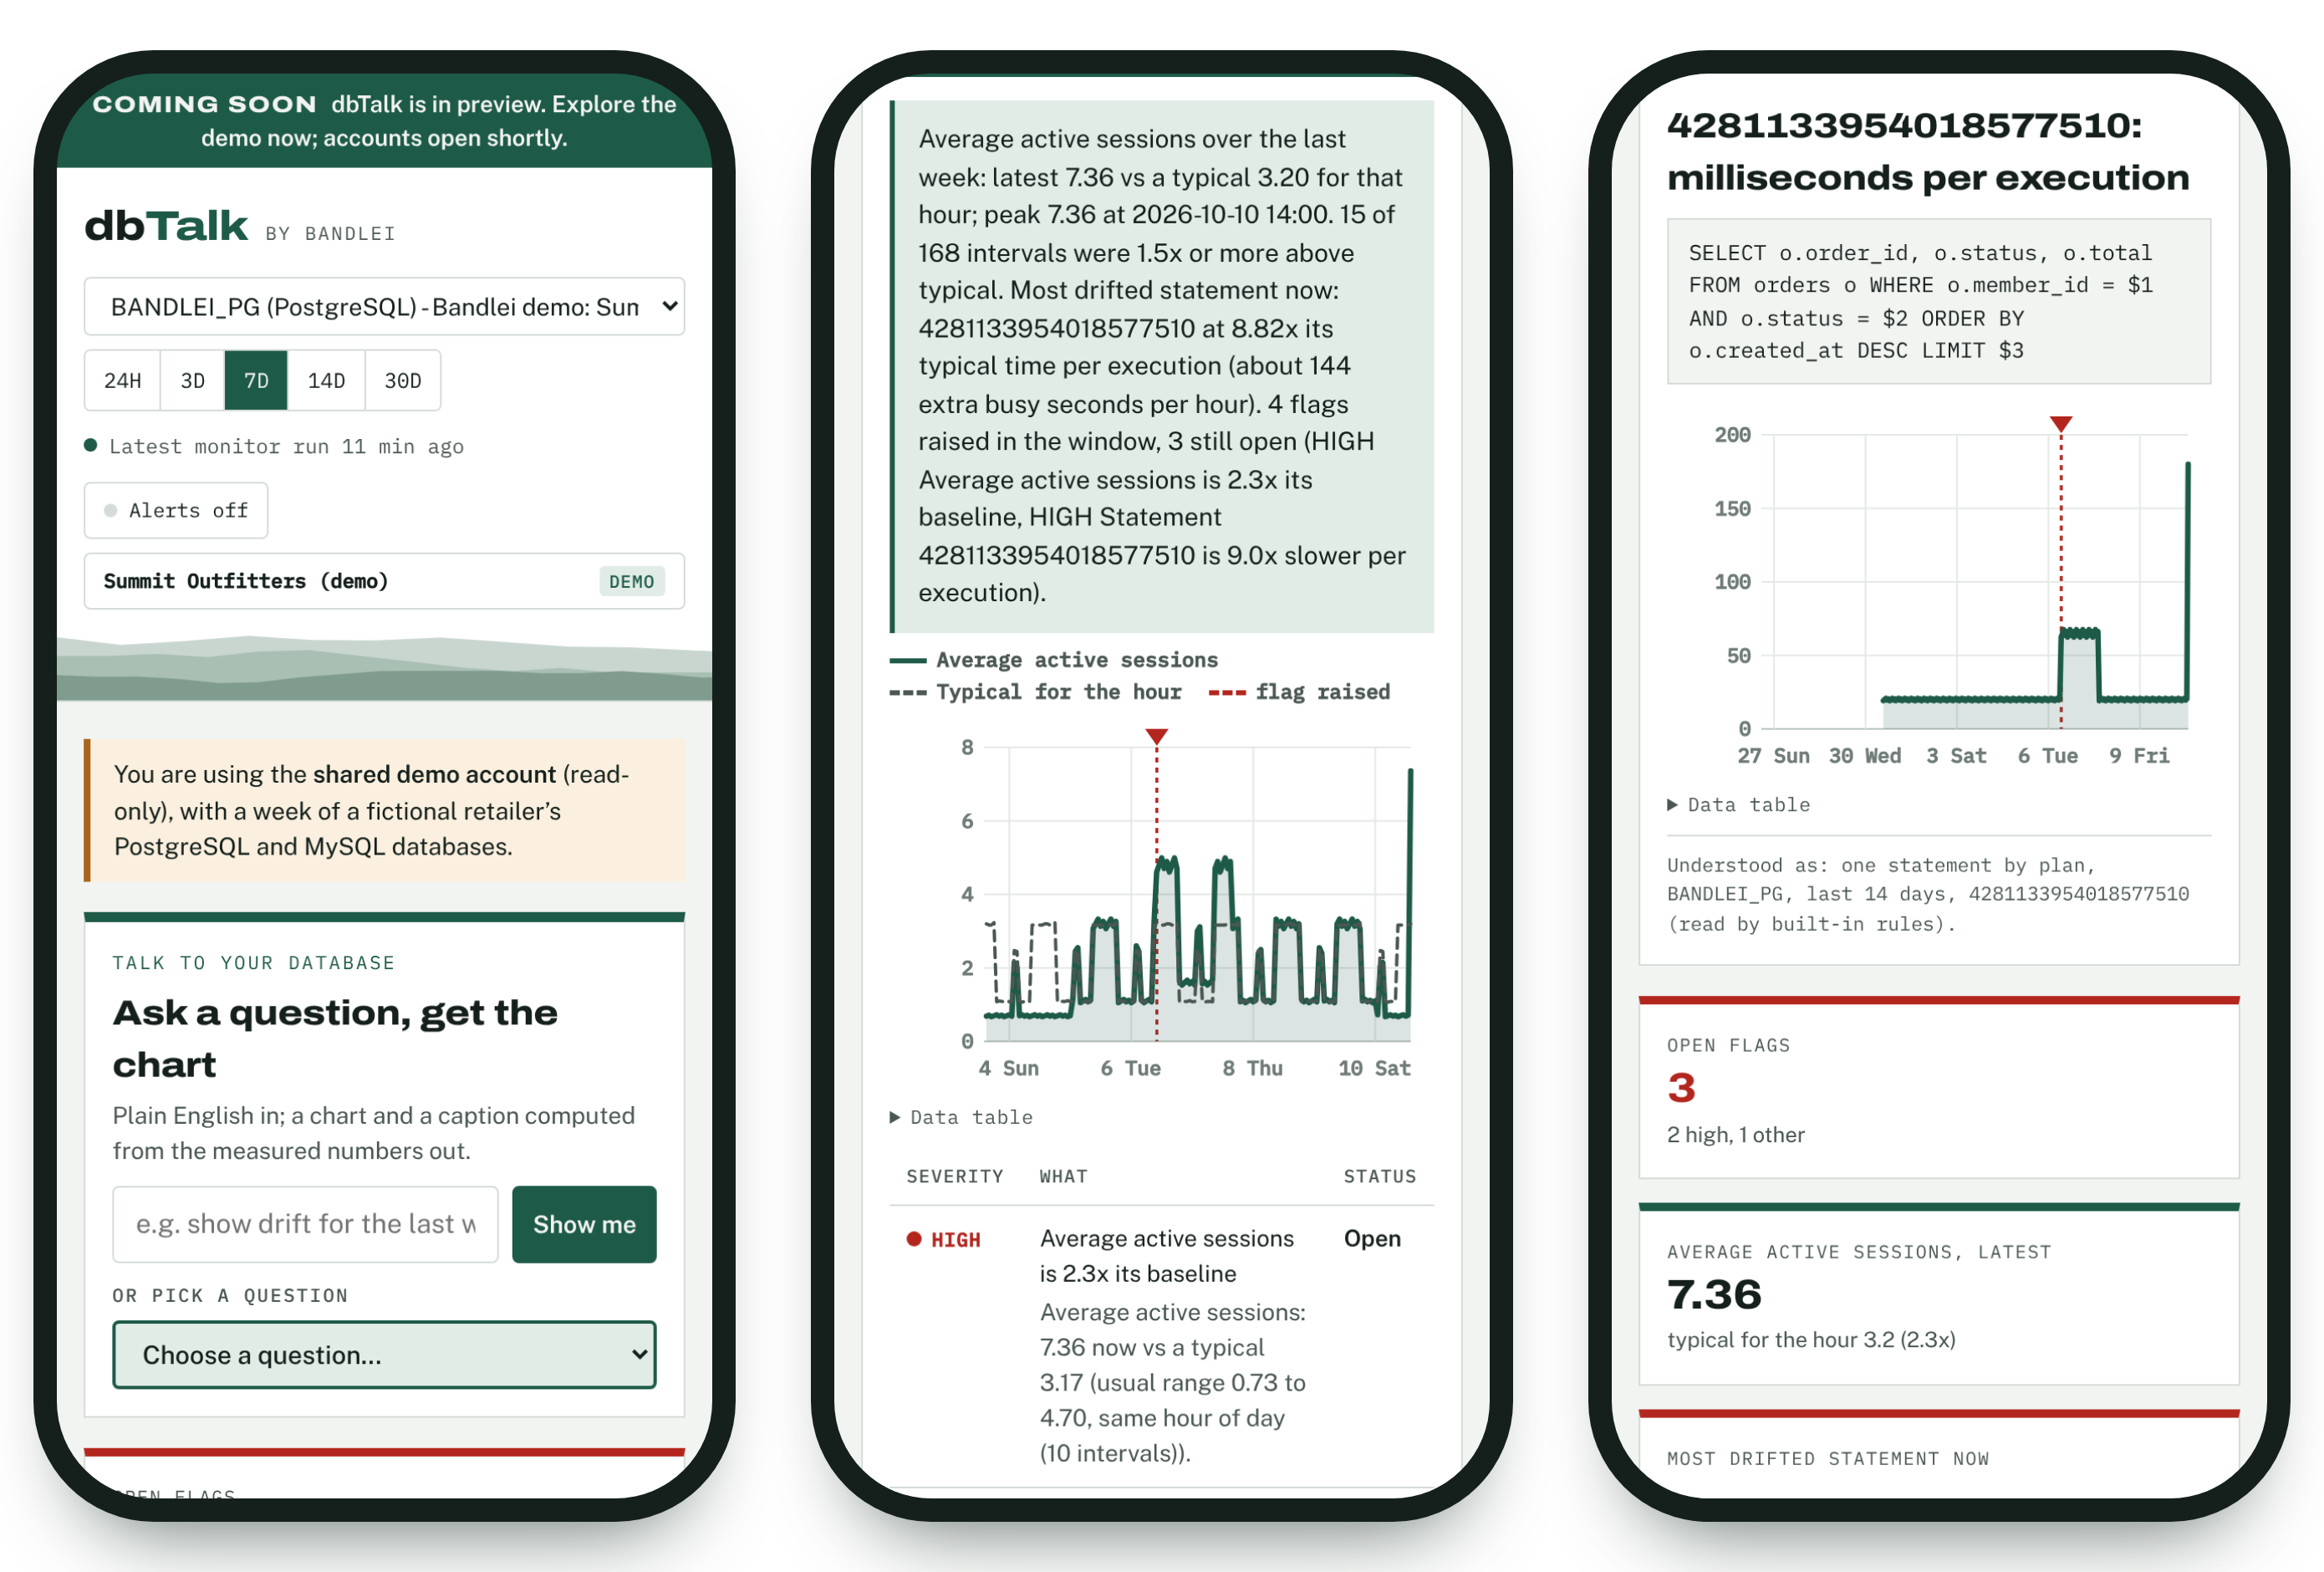
dbTalk installs from the browser on iPhone, Android and desktops, with no app store. Turn on alerts and a new regression arrives as a notification that names the database, never the SQL or the numbers; tap it and the chart opens.

Three phones showing the dbTalk dashboard, a week of drift answered in plain English, and one statement's time per execution.
The installed app on a phone (demo data).

Add a database, see the first week of drift

Add a database with the read-only user and dbTalk tests the connection and every statistic it reads before saving. Within a week it knows what normal looks like for each hour of the day.

Adding a database: the form and a connection test with every item OK and one optional item with its command.
Add a database: dbTalk tests the connection and every statistic it reads before saving. TLS by default.

Nothing to install

HOSTED BY BANDLEI

Sign in at app.bandlei.com

Nothing to install. dbTalk connects to your database over TLS with a read-only user, from one fixed address you allow through the firewall or security group.

  • no install
  • TLS
  • read-only
CLOUD DATABASES

RDS, Aurora, Azure, Cloud SQL

Works with the managed services’ own statistics: turn on pg_stat_statements or performance_schema in the parameter group or server flags; the guide lists each setting.

  • AWS
  • Azure
  • Google Cloud
AGENT PLATFORM

MCP or REST

Register the tool server over MCP or OpenAPI. Every tool is read-only, validated, redacted and audited.

  • MCP
  • OpenAPI 3.1
  • JSON

Coming next

The website, questions and flagging are engine-independent; each engine needs only a collector.

  • PlannedSQL Server and Azure SQLQuery Store, with plan history.
  • PlannedPlan history for PostgreSQLPlan ids from pg_stat_monitor when both extensions are installed.
  • PlannedSlack and Teams alertsNext to phone notifications.

See dbTalk on your own databases

Ask Bandlei for a guided pilot. All it takes is one read-only database user.

Contact Bandlei