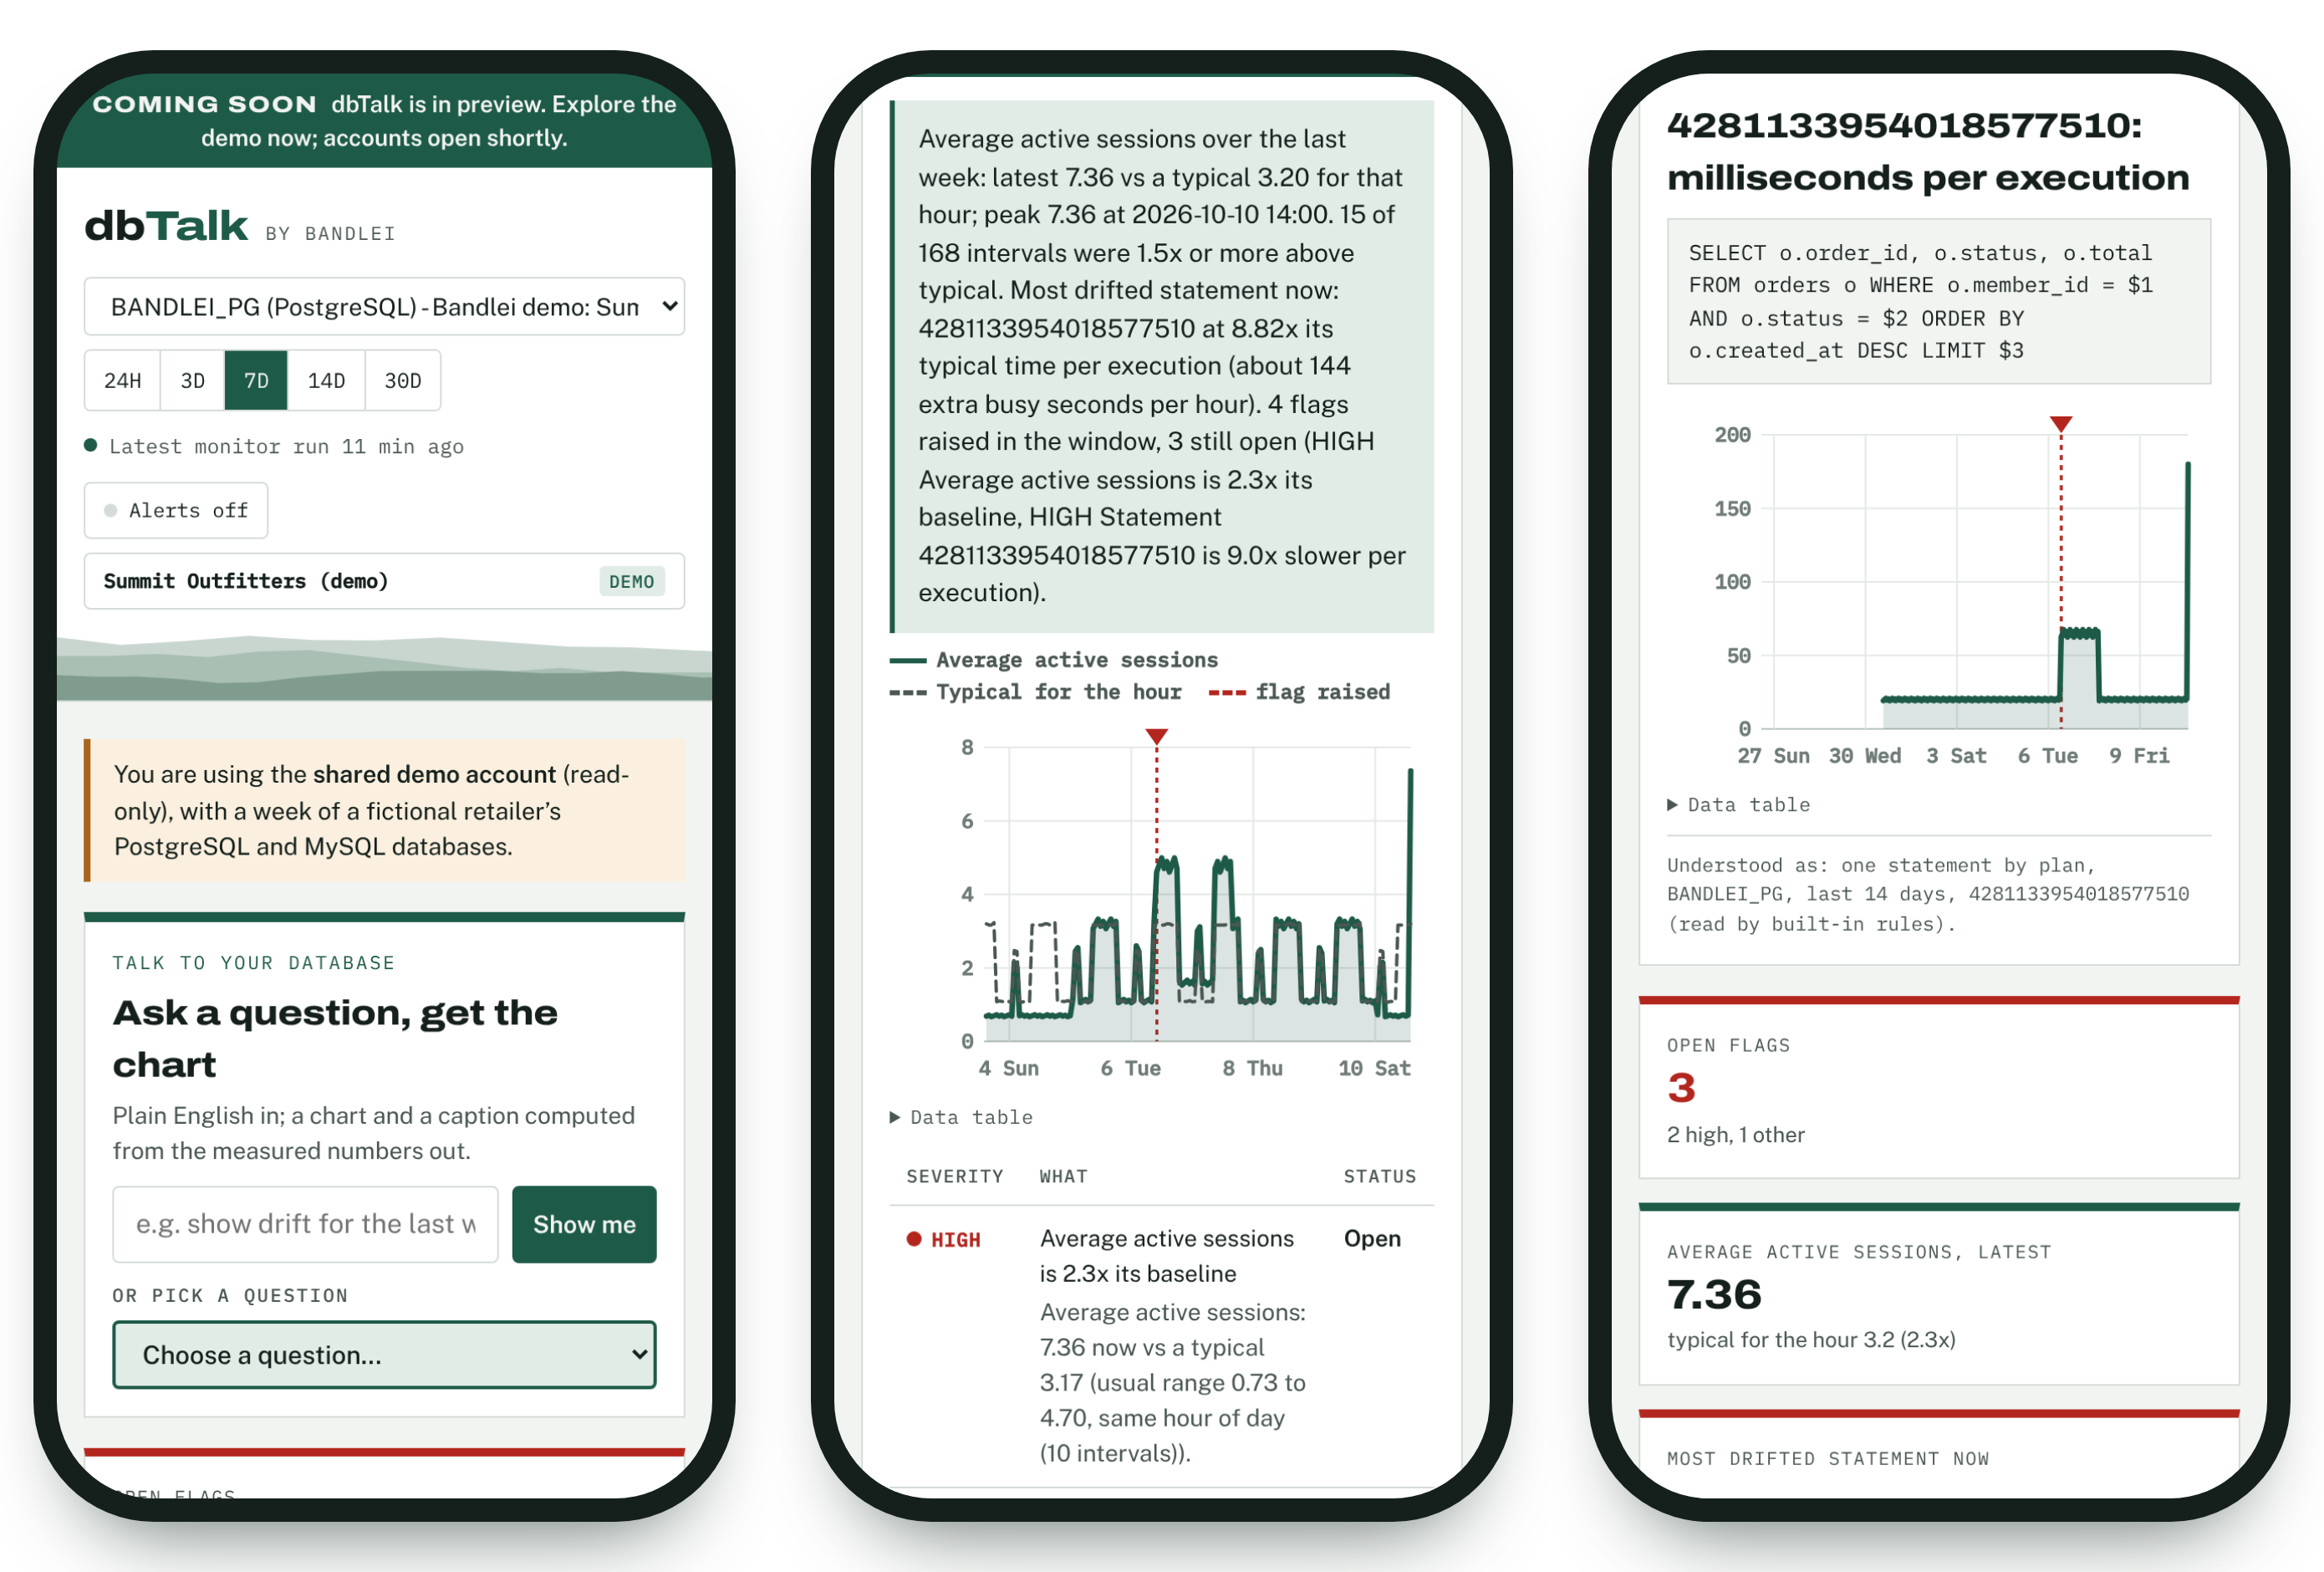
Talk to your database
Ask a question, get the chart
Plain English in; a chart and a caption computed from the measured numbers out.
Load
Average active sessions
Each point is one monitor interval. The dashed line is the typical value for that hour of day. Markers show when drift flags were first raised.
Statements
Statement drift
Time per execution: typical is the median over the window. Click a statement id to chart it; Analyze reads its statistics and plan now and writes the fix script.
Findings
Flags
Each row is one flag from when it was first raised until it resolved.
System