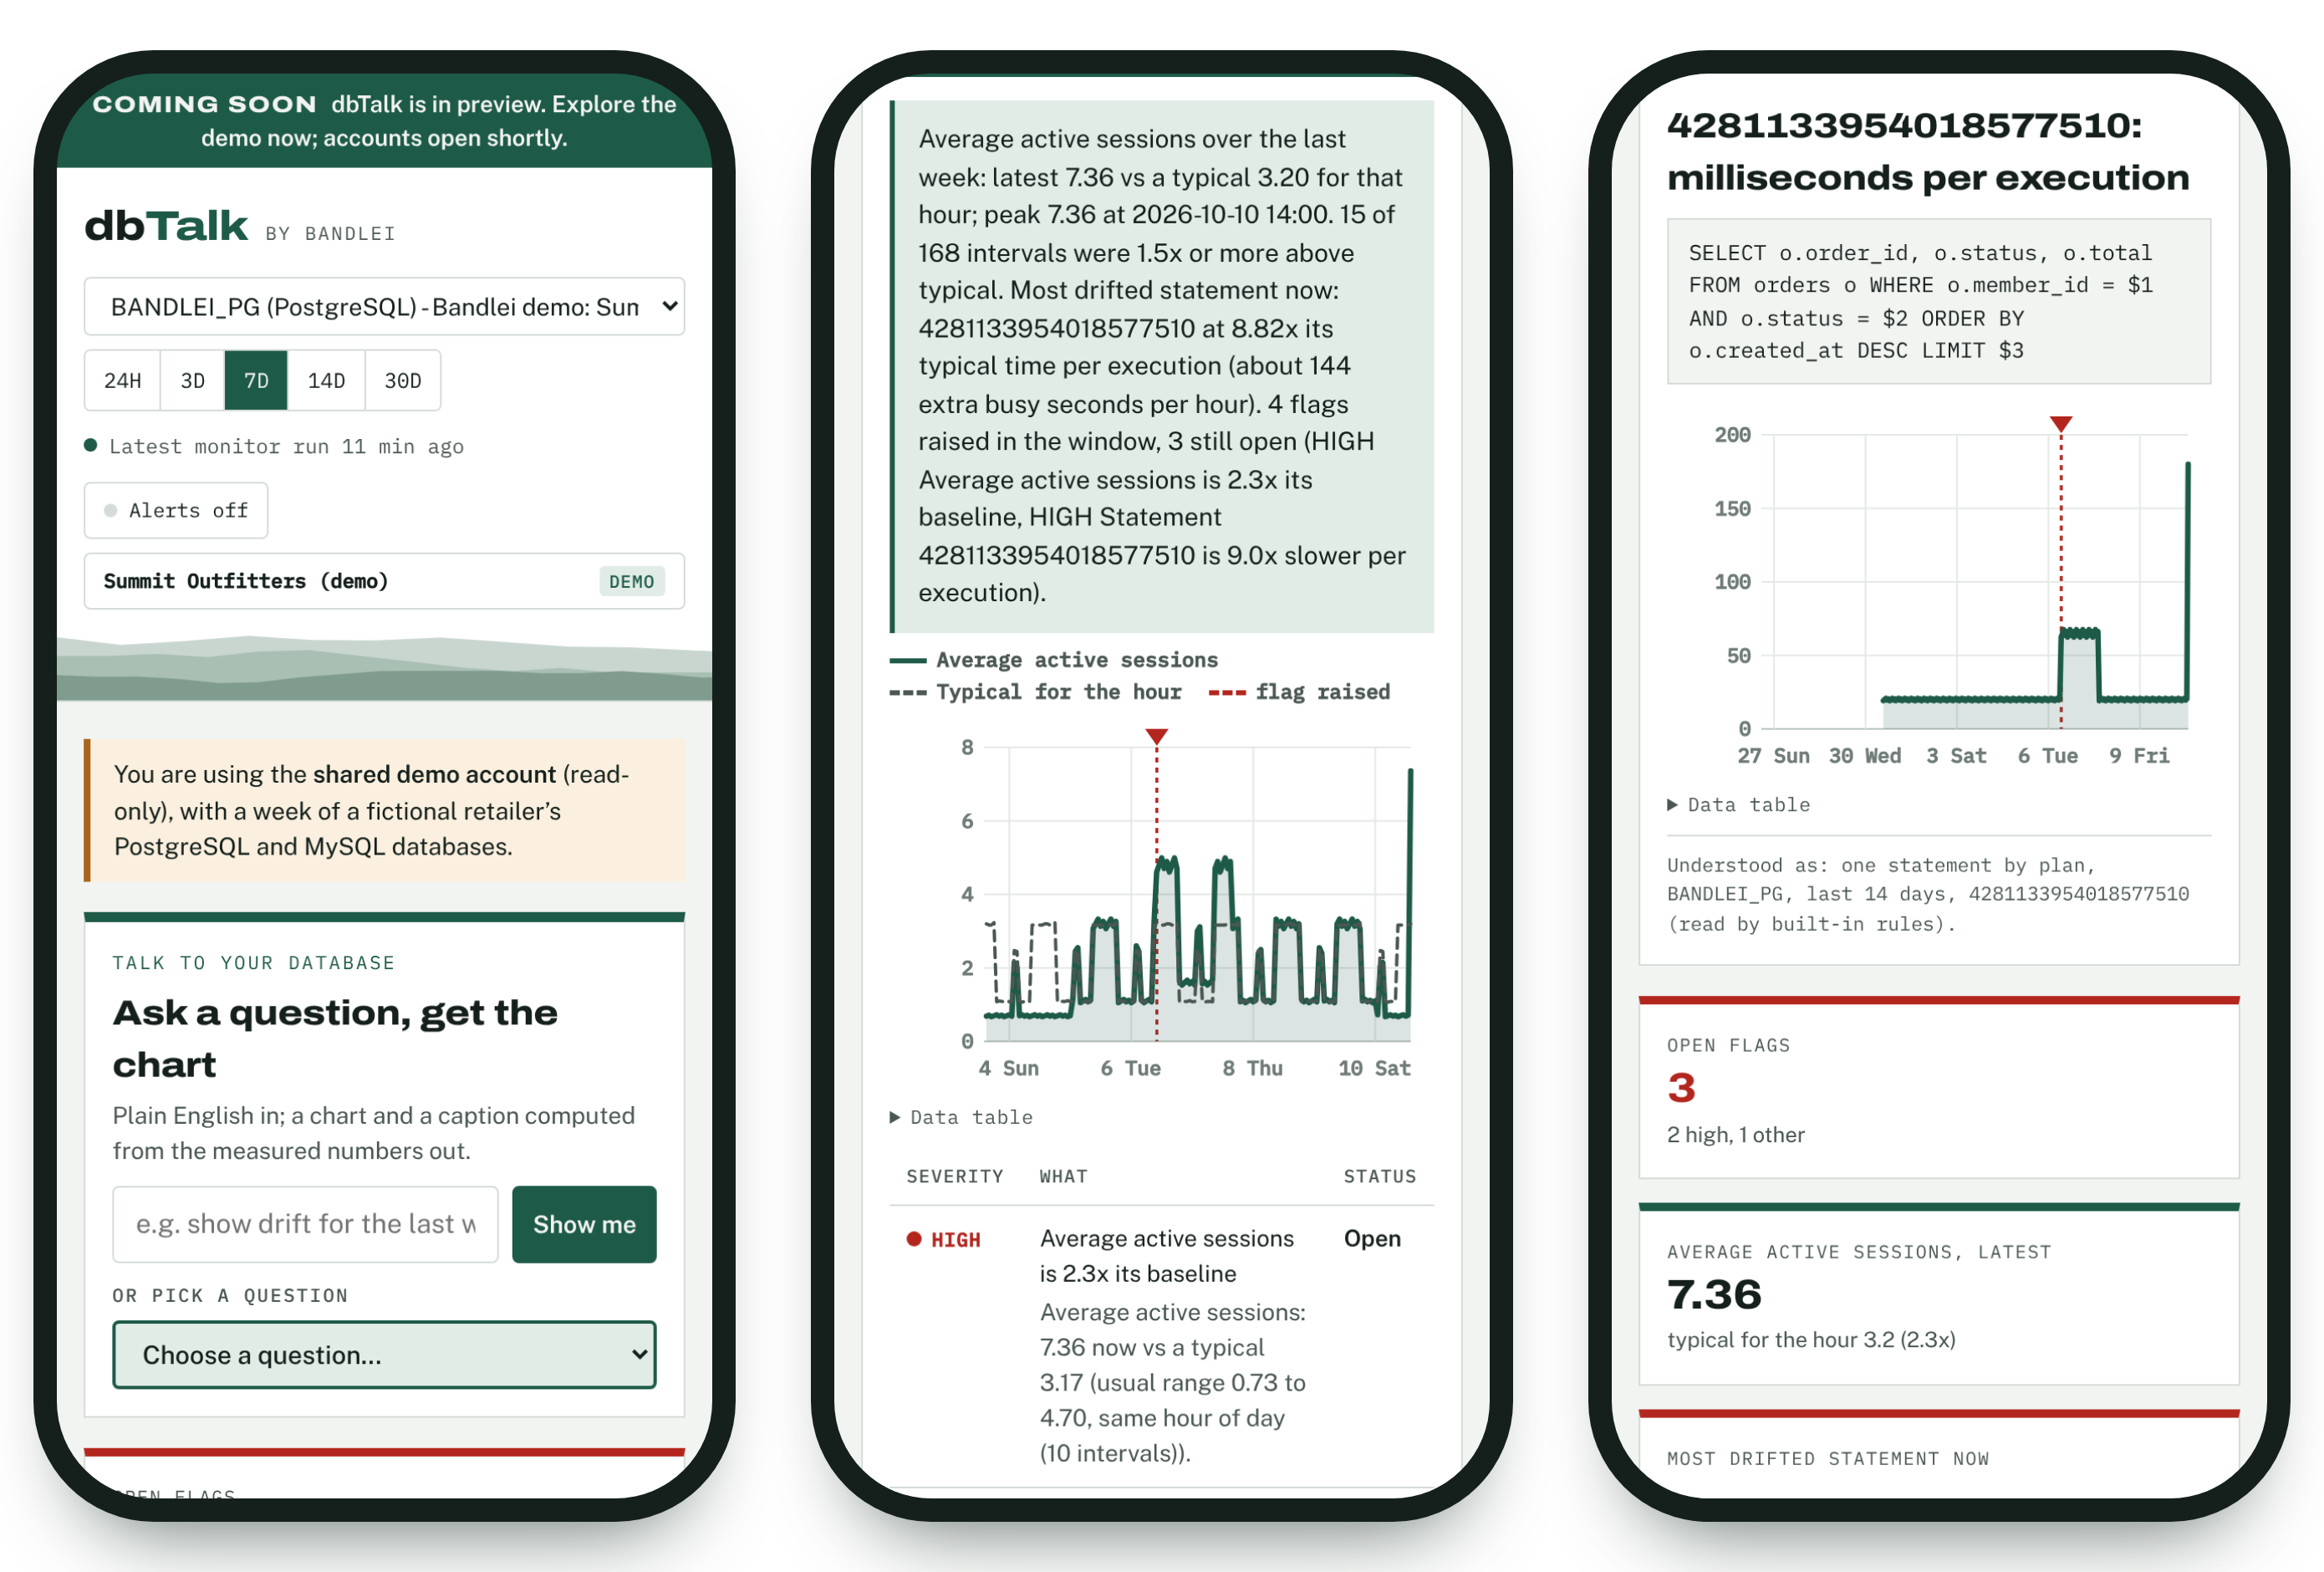
Talk to your database
Ask a question, get the chart
Plain English in; a chart and a caption computed from the measured numbers out.
Load
Average active sessions
Each point is one monitor interval. The dashed line is the typical value for that hour of day. Markers show when drift flags were first raised.
Live now
What is happening right now
Reads the database this moment: running and idle-in-transaction sessions, who is blocked, what sessions wait on and replica lag. Cheap read-only queries with a 5 second limit; repeat reads within 10 seconds share one answer.
Statements
Statement drift
Time per execution: typical is the median over the window. Click a statement id to chart it; Analyze reads its statistics and plan now and writes the fix script.
Tables
Busiest tables
Rows read and written per second through each table, averaged over the range, and the latest interval against that table’s usual for the hour. Full and index scans on PostgreSQL; time spent in table I/O on MySQL.
Contention
Blocking
Sessions found waiting on another session’s lock, per table, and who held it. Checked at each monitor run (and every minute when blocking sampling is scheduled), so waits shorter than that can be missed.
Sessions
Long-running and idle-in-transaction
The oldest open transaction and the longest idle-in-transaction session at each check, and the sessions that stayed open longest. An open transaction holds locks and stops vacuum (PostgreSQL) or purge (InnoDB) from cleaning up.
Replication
Replica lag
How far each replica is behind, at each check, and on PostgreSQL the WAL each replication slot holds back. An inactive slot keeps WAL until the disk fills.
Deadlocks
Deadlocks
Each deadlock dbTalk could read, with the tables, the statements and the session that was rolled back. PostgreSQL detail comes from the server log (needs pg_read_server_files); MySQL keeps only the latest one, so the minute sampler catches more.
Waits
What sessions wait on
Average sessions waiting per hour, by kind of wait, and the top wait events against their usual for the hour. CPU means running, not waiting.
Storage
Size, growth and capacity
Database size over time with a straight-line projection from the last 30 days’ growth, the capacity set for it, and the largest tables with their growth and reclaimable space.
Findings
Flags
Each row is one flag from when it was first raised until it resolved.
System